There’re several plugins that can make our lives much easier when working with line charts in Flutter. In this tutorial, we’ll use fl_chart, one of the most-used chart plugins these days.
Installation
The new way to install fl_chart is by running this command:
flutter pub pub add fl_chartIt’s totally fine if you prefer the old steps as below.
1. Add fl_chart: ^0.45.1 to the dependencies section in your pubspec.yaml, like this:
dependencies:
  flutter:
    sdk: flutter
  fl_chart: ^0.62.0
At the time of writing, 0.62.0 is the latest version of the package.
2. Run:
flutter pub get3. Import the plugin to your dart file:
import 'package:fl_chart/fl_chart.dart';Examples
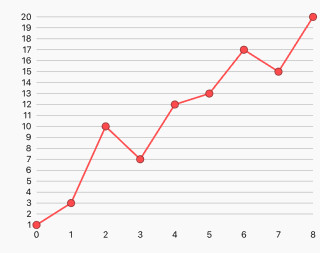
Example 1: Basic Single-Line Chart
Container(
        padding: const EdgeInsets.all(10),
        width: double.infinity,
        height: 300,
        child: LineChart(
          LineChartData(borderData: FlBorderData(show: false), lineBarsData: [
            LineChartBarData(spots: [
              const FlSpot(0, 1),
              const FlSpot(1, 3),
              const FlSpot(2, 10),
              const FlSpot(3, 7),
              const FlSpot(4, 12),
              const FlSpot(5, 13),
              const FlSpot(6, 17),
              const FlSpot(7, 15),
              const FlSpot(8, 20)
            ])
          ]),
        ),
),
Output:
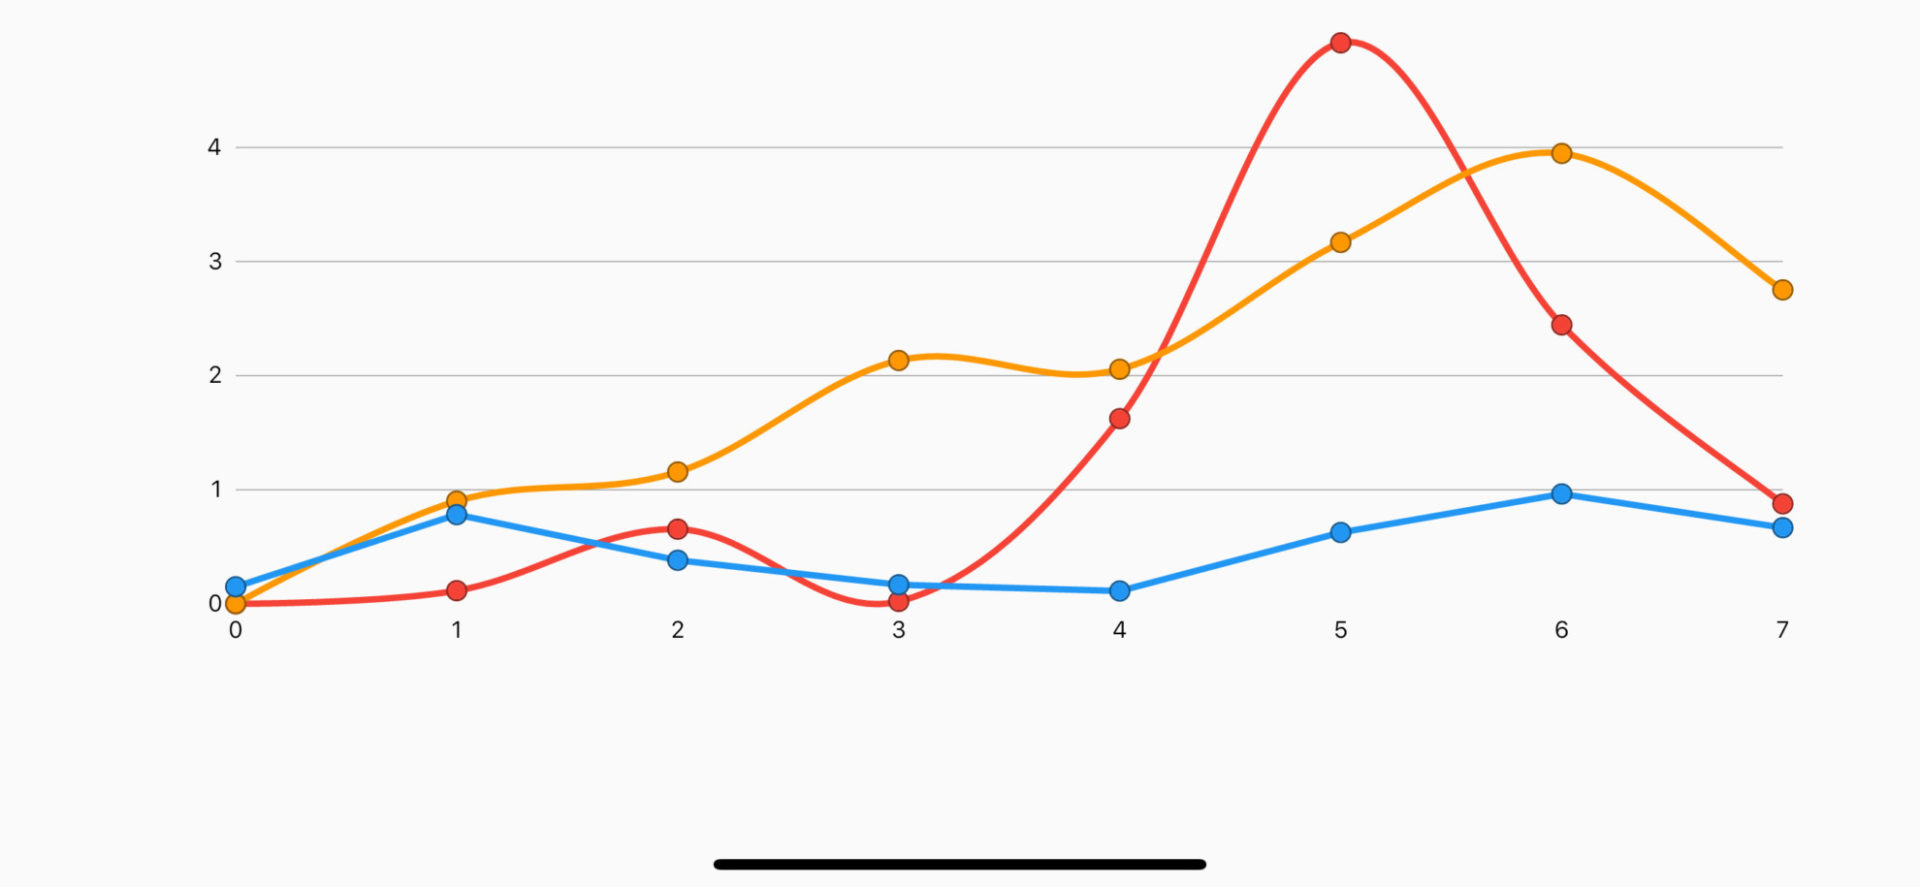
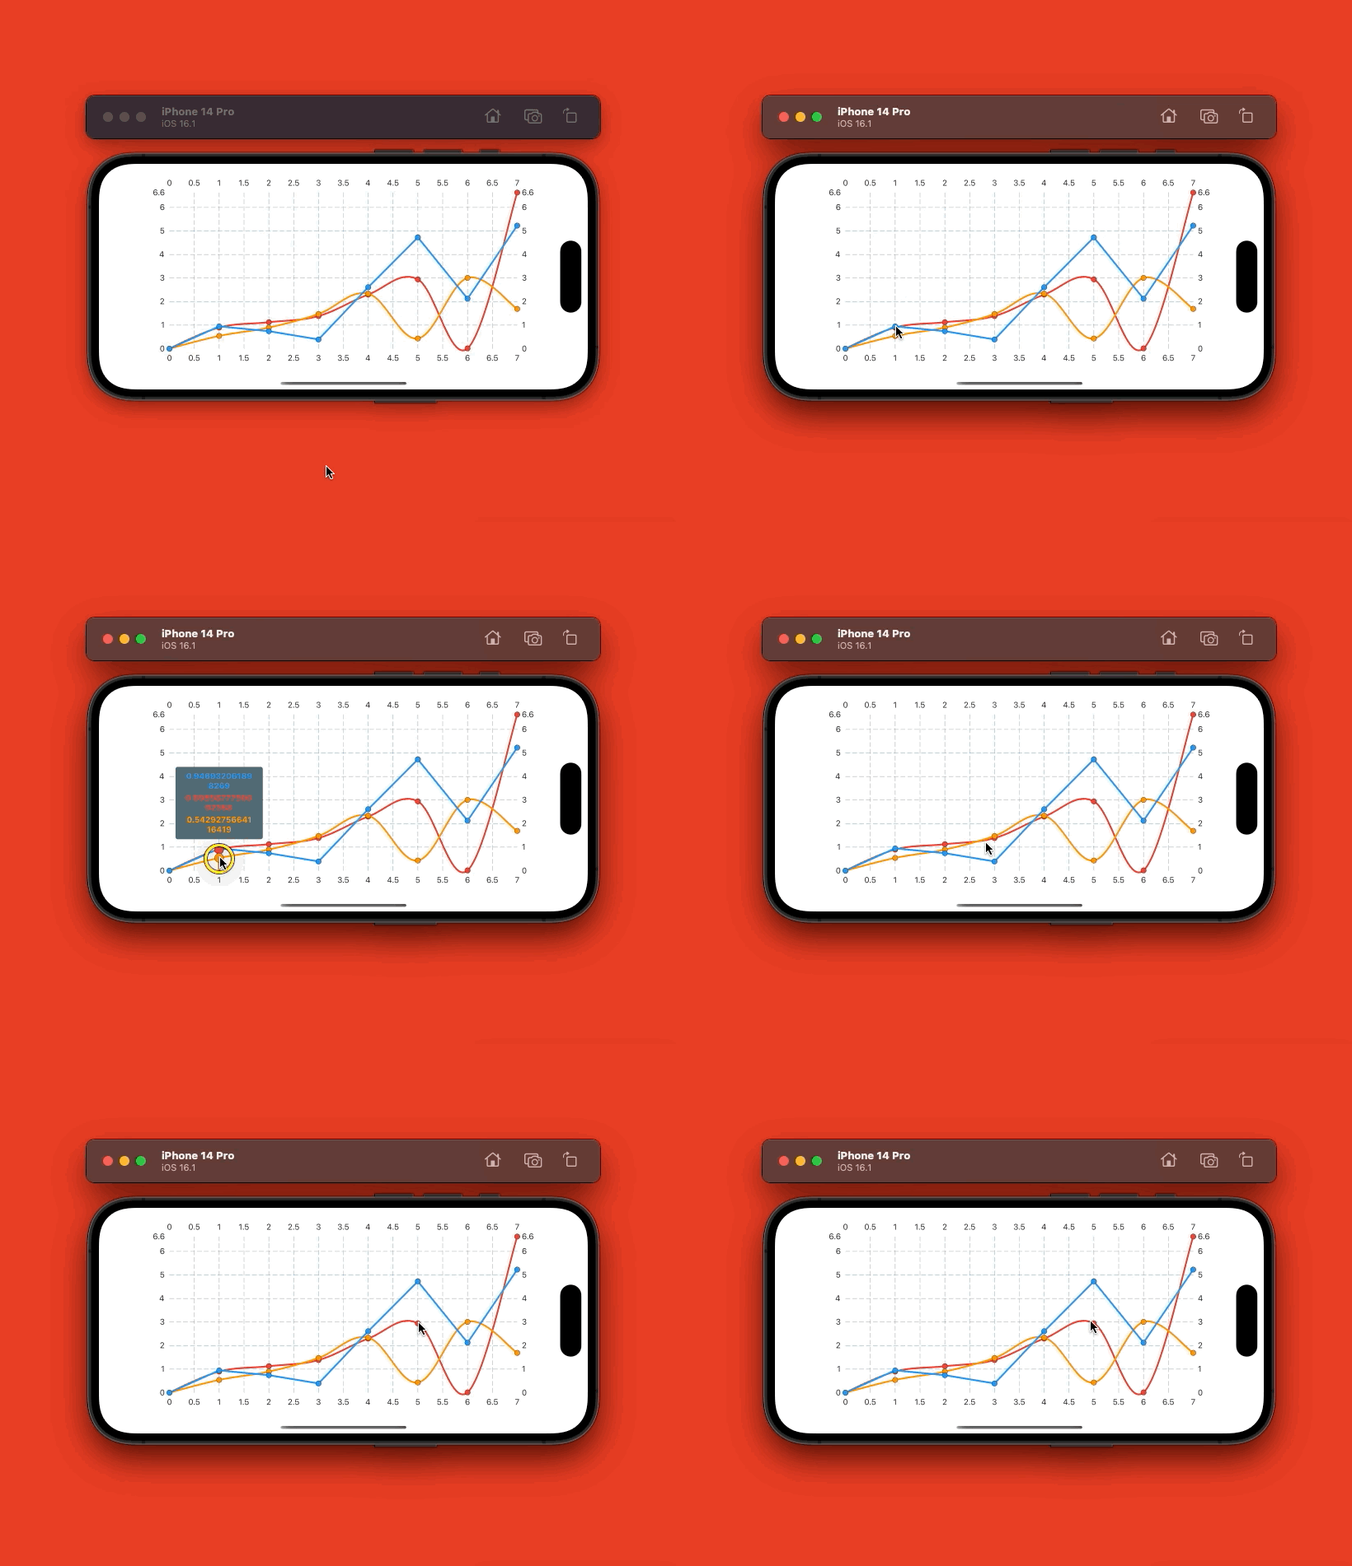
Example 2: Multi-Line Chart With Curved Lines
Preview (the chart is big so it’s better to view it in landscape mode):
The complete code:
// main.dart
import 'package:flutter/material.dart';
import 'dart:math';
import 'package:fl_chart/fl_chart.dart';

void main() {
  runApp(const MyApp());
}

class MyApp extends StatelessWidget {
  const MyApp({Key? key}) : super(key: key);
  @override
  Widget build(BuildContext context) {
    return MaterialApp(
        // Remove the debug banner
        debugShowCheckedModeBanner: false,
        title: 'KindaCode.com',
        theme: ThemeData(
          primarySwatch: Colors.indigo,
        ),
        home: MyHomePage());
  }
}

class MyHomePage extends StatelessWidget {
  MyHomePage({Key? key}) : super(key: key);

  // Generate some dummy data for the cahrt
  // This will be used to draw the red line
  final List<FlSpot> dummyData1 = List.generate(8, (index) {
    return FlSpot(index.toDouble(), index * Random().nextDouble());
  });

  // This will be used to draw the orange line
  final List<FlSpot> dummyData2 = List.generate(8, (index) {
    return FlSpot(index.toDouble(), index * Random().nextDouble());
  });

  // This will be used to draw the blue line
  final List<FlSpot> dummyData3 = List.generate(8, (index) {
    return FlSpot(index.toDouble(), index * Random().nextDouble());
  });

  @override
  Widget build(BuildContext context) {
    return Scaffold(
      body: SafeArea(
        child: Container(
          padding: const EdgeInsets.all(20),
          width: double.infinity,
          child: LineChart(
            LineChartData(
              borderData: FlBorderData(show: false),
              lineBarsData: [
                // The red line
                LineChartBarData(
                  spots: dummyData1,
                  isCurved: true,
                  barWidth: 3,
                  color: Colors.red,
                ),
                // The orange line
                LineChartBarData(
                  spots: dummyData2,
                  isCurved: true,
                  barWidth: 3,
                  color: Colors.orange,
                ),
                // The blue line
                LineChartBarData(
                  spots: dummyData3,
                  isCurved: false,
                  barWidth: 3,
                  color: Colors.blue,
                )
              ],
            ),
          ),
        ),
      ),
    );
  }
}
Conclusion
We’ve explored a popular chart plugin and gone over a few examples of using it to create line charts. From now on, you will get more comfortable when dealing with this task. If you would like to learn more about Flutter, take a look at the following articles:
- Sorting Lists in Dart and Flutter (5 Examples)
- How to draw Bar Charts with fl_chart in Flutter
- Flutter and Firestore Database: CRUD example
- How to disable Web and Desktop support in Flutter
- How to Add a Drop Shadow to Text in Flutter
- Understanding Typedefs (Type Aliases) in Dart and Flutter
You can also take a tour around our Flutter topic page and Dart topic page to see the latest tutorials and examples.

