There are various libraries out there to help you create a beautiful pie chart (aka circle chart, pie graph, etc.) in React without any pain. This article will walk you through the most outstanding ones among them.
Table of Contents
VictoryPie
A very easy-to-use chart drawing library. It also supports TypeScript out of the box.
Example
Install victory-pie by executing the command below:
yarn add victory-pieOr:
npm install victory-pie --saveCreate a new React app and replace the default code in your App.js with the following snippet:
import React from "react";
import { VictoryPie } from "victory-pie";

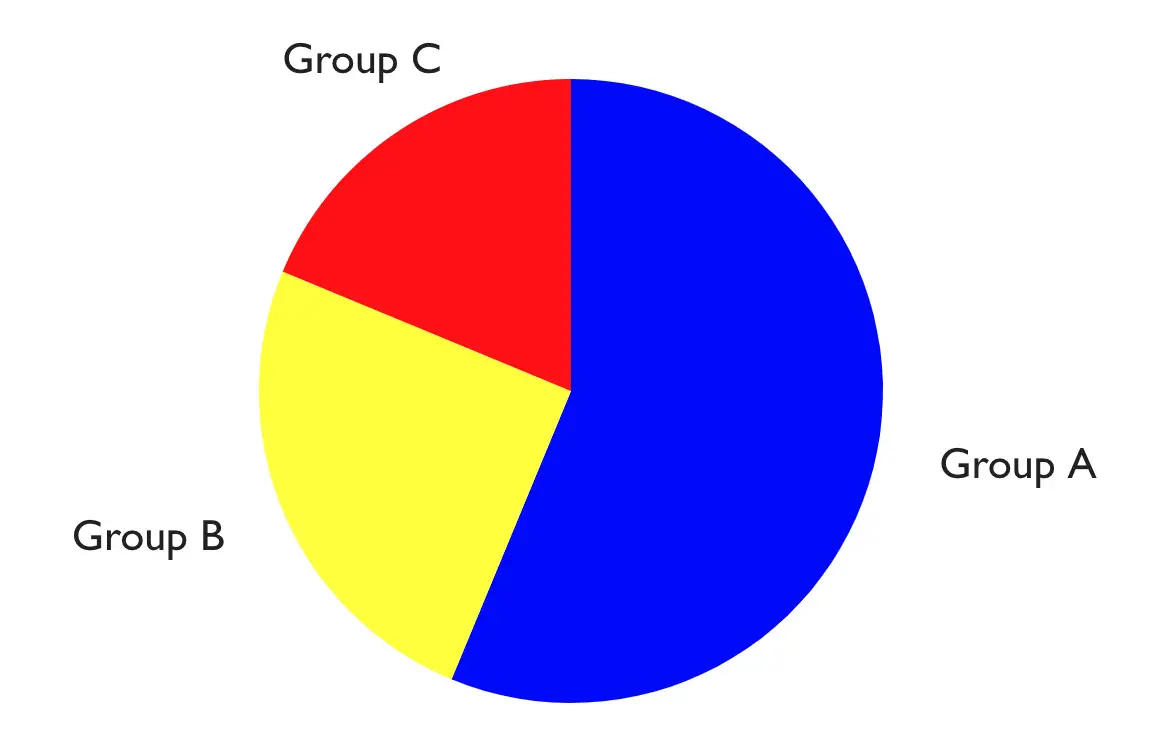
const myData = [
  { x: "Group A", y: 900 },
  { x: "Group B", y: 400 },
  { x: "Group C", y: 300 },
];

const App = () => {
  return (
    <div>
      <VictoryPie
        data={myData}
        colorScale={["blue", "yellow", "red"]}
        radius={100}
      />
    </div>
  );
};

export default App;
Result:
Learn more: https://github.com/formidablelabs/victory
Recharts
This one is not very small in size but powerful. It supports Native SVG and TypeScript, so you don’t have to install typing packages to write your code in the modern standard.
Install:
npm install recharts --saveOr:
yarn add rechartsExamples
App.js:
import React from "react";
import { PieChart, Pie, Tooltip } from "recharts";

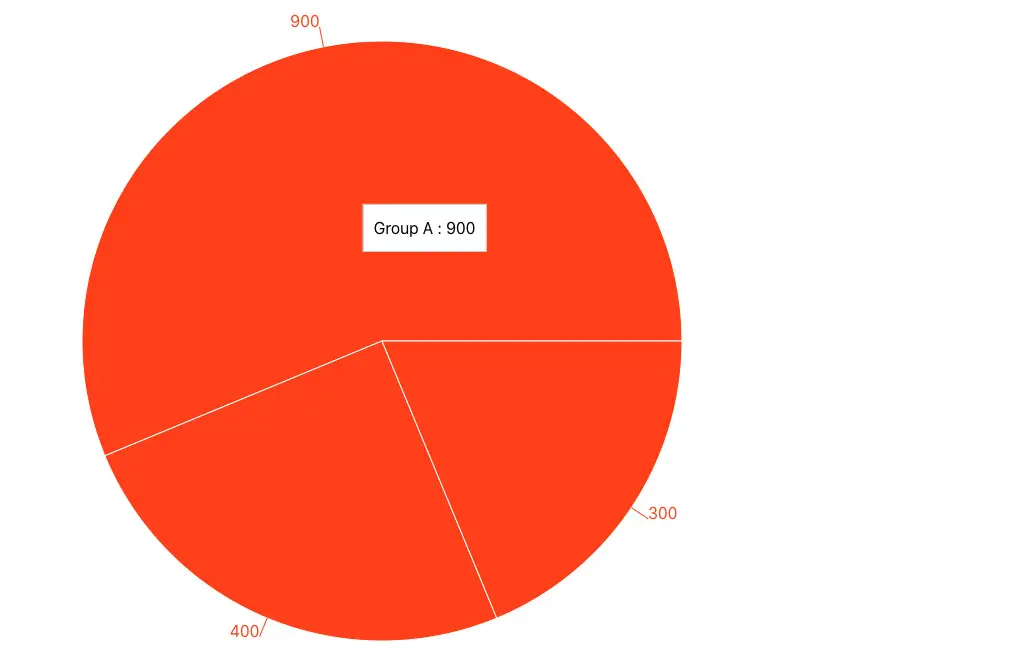
const myData = [
  { name: "Group A", value: 900 },
  { name: "Group B", value: 400 },
  { name: "Group C", value: 300 },
];

const App = () => {
  return (
    <PieChart width={800} height={800}>
      <Pie
        dataKey="value"
        isAnimationActive={true}
        data={myData}
        outerRadius={300}
        fill="orangered"
        label
      />

      {/* Display the tooltips */}
      <Tooltip />
    </PieChart>
  );
};

export default App;
Execute npm start and browse to http://localhost:3000. You’ll see something like this:
Learn more about recharts: https://github.com/recharts/recharts
react-minimal-pie-chart
A lightweight library for creating pie graphs with versatile options and CSS animation included. The unpacked size is about 169 kB, while the gzipped size is less than 2 kB.
Example
Install:
npm install react-minimal-pie-chart --saveThe code in the App.js file:
import React from "react";
import { PieChart } from "react-minimal-pie-chart";

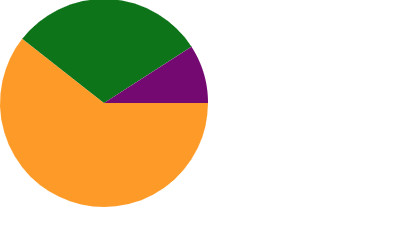
const myData = [
  { title: "Dogs", value: 100, color: "orange" },
  { title: "Cats", value: 50, color: "green" },
  { title: "Dragons", value: 15, color: "purple" },
];

const App = () => {
  return (
    <div>
      <PieChart
        // your data
        data={myData}
        // width and height of the view box
        viewBoxSize={[600, 600]}
      />
    </div>
  );
};

export default App;
Output:
Reference: https://github.com/toomuchdesign/react-minimal-pie-chart
Final Words
We’ve gone through a couple of different open-source libraries for drawing better pie charts without writing code from scratch for such things. If you’d like to explore more new and exciting things about modern React development, take a look at the following articles:
- React Router Dom: Implement a Not Found (404) Route
- React + TypeScript: Working with Props and Types of Props
- React + TypeScript: Multiple Select example
- React + TypeScript: Making a Custom Context Menu
- Most popular React Component UI Libraries
- Best Libraries for Formatting Date and Time in React
You can also check our React topic page and React Native topic page for the latest tutorials and examples.
